1528+
MWp Capacity435+
Projects1528+
MWp Capacity435+
Projects1528+
MWp Capacity435+
Projects1528+
MWp Capacity435+
Projects
1528+
MWp Capacity435+
Projects1528+
MWp Capacity435+
Projects1528+
MWp Capacity435+
Projects1528+
MWp Capacity435+
Projects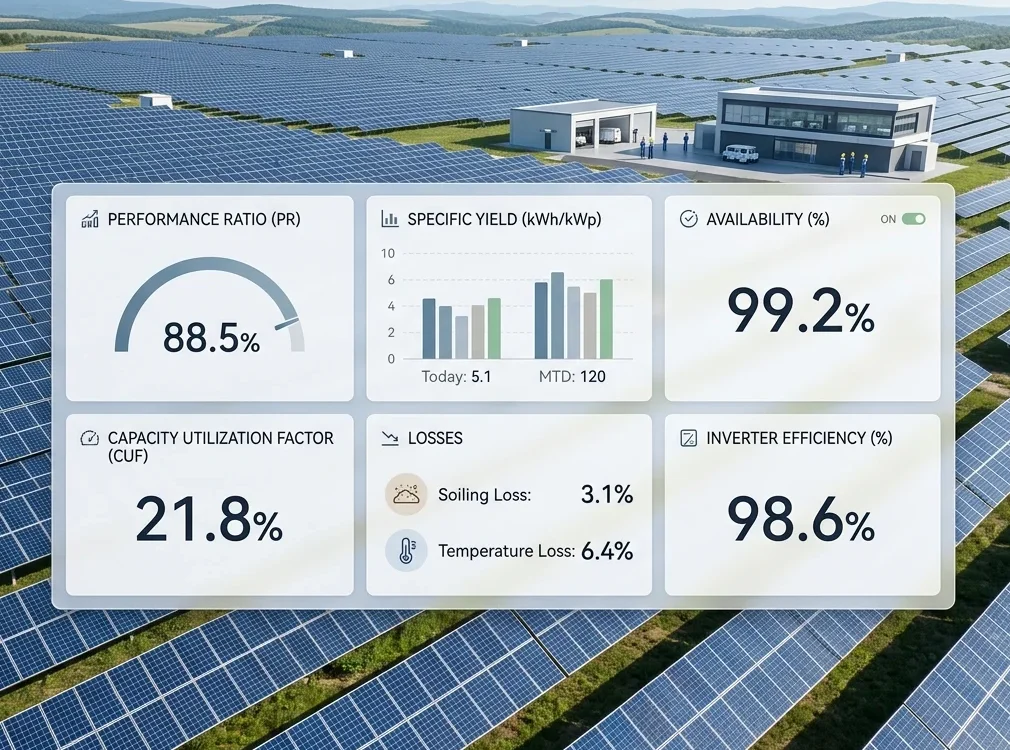
In solar power operations, effective O&M monitoring goes well beyond logging daily energy output. It requires evaluating system performance against precise technical data aligned with international standards such as IEC 61724, the globally recognized framework for measuring photovoltaic system performance.
For asset owners and businesses operating solar energy systems, a clear understanding of SLA and KPI frameworks is essential for managing technical risk, optimizing performance, and protecting return on investment (ROI) over the long term.
Performance Ratio is one of the most critical indicators in solar energy systems, measuring how effectively a plant converts available solar irradiance into usable electricity.
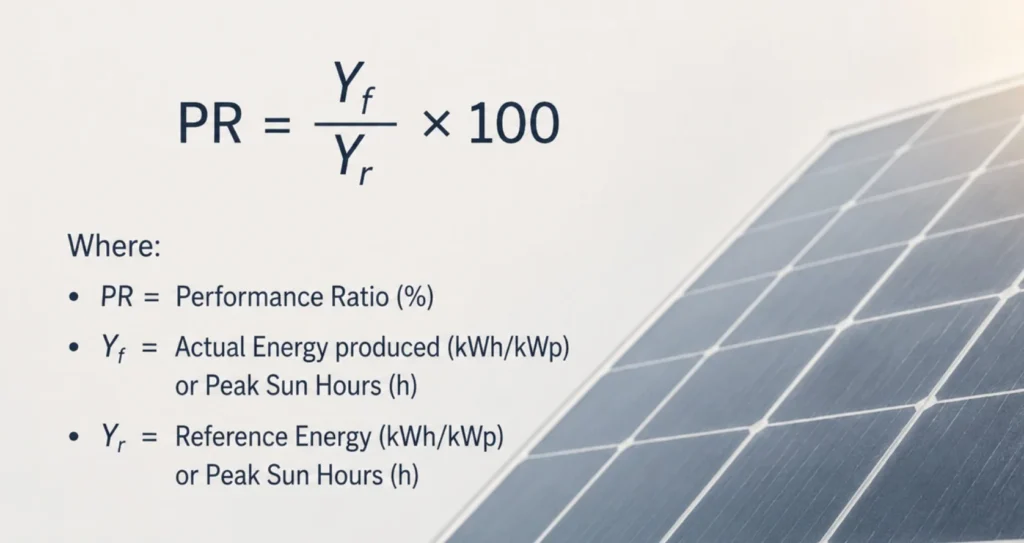
Practical Example
A solar plant with:
This indicates strong operational performance. However, if PR falls from 80% to 70% under identical irradiance conditions, the root cause is likely panel soiling or inverter underperformance. In the context of SLA and KPI compliance, a sustained PR below threshold is a reportable event that triggers corrective action under the O&M service agreement.
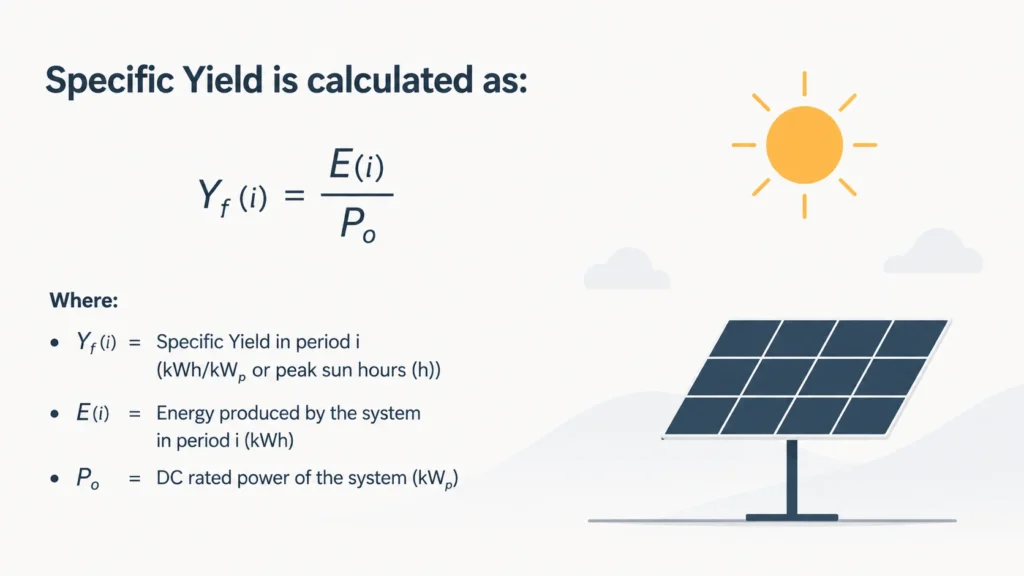
Practical Example
For a 1 MWp system in the same region:
When irradiance conditions remain unchanged, a decline in Specific Yield is typically caused by accumulated soiling, reduced inverter efficiency, or partial system underperformance. Based on industry O&M experience, a drop of 5 to 10% from the established baseline warrants an operational review and should not be overlooked.
Downtime in solar systems most commonly originates from inverter faults, DC cable failures, or grid interruptions. Professional O&M operations typically target System Availability of 98% or higher to protect generation output and long-term investment performance.
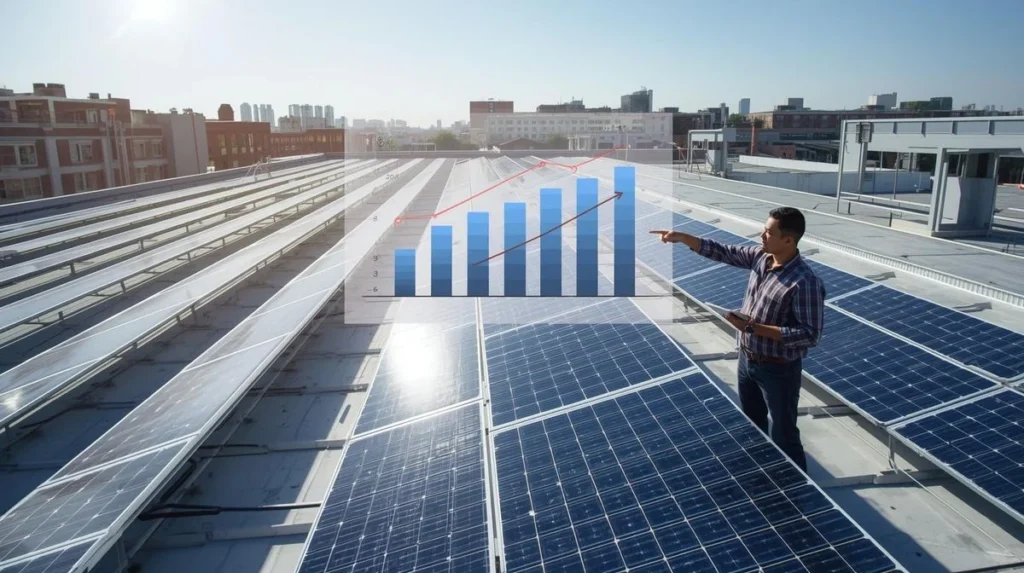
Practical Example
A solar plant in a given month:
Effective downtime affecting generation: 16 hours Availability = 704 / 720 = 97.8%
This represents a well-functioning plant with low downtime. However, monitoring and continuous improvement remain necessary to reach and maintain the 98% threshold specified in most O&M service level agreements.
CUF provides a holistic view of overall system utilization and is especially relevant in large-scale industrial solar and solar farm projects.
Practical Example
A 1 MWp solar system:
If output drops to 1,500,000 kWh under the same conditions, CUF falls to approximately 17.1%, below the standard threshold. Potential causes include prolonged soiling, inverter derating or clipping, or elevated system downtime.
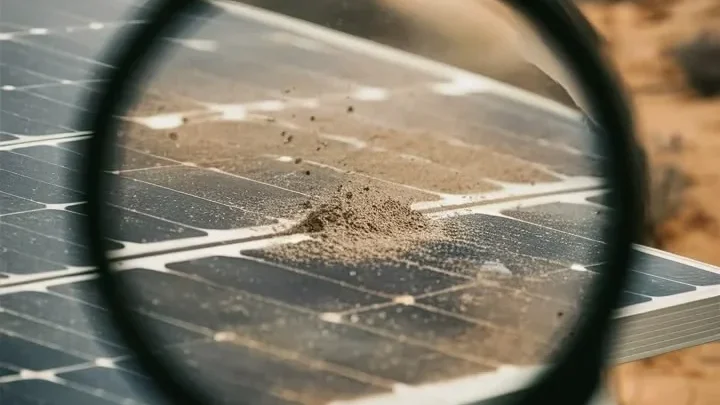
Practical Example
A rooftop solar system at an industrial facility:
For a system normally generating 150,000 kWh per month, these two factors can result in a loss of 22,000 to 27,000 kWh per month. Soiling and thermal degradation are gradual losses that accumulate significantly over time. Establishing data-driven cleaning schedules can substantially improve yield without additional capital expenditure.
The inverter is the central conversion unit of any solar energy system, and its performance directly determines overall energy output.
Practical Example
An inverter operating normally:
After extended operation, the same inverter records:
This decline may be caused by:
In a solar energy system, KPIs serve not only as performance monitoring tools but also as early warning indicators for technical risks such as hotspots, potential-induced degradation (PID), or progressive module efficiency decline.
Continuous monitoring allows O&M operators to detect anomalies before they result in significant generation losses or equipment damage. The most effective approach combines real-time monitoring with structured preventive maintenance, which is especially important in large-scale solar facilities.
Businesses operating solar assets should partner with O&M providers that have established quality frameworks and robust reporting processes. This ensures that SLA and KPI commitments are clearly defined, consistently measured, and transparently reported throughout the asset lifecycle.
Electric Bird delivers international-standard O&M solutions for solar energy systems across factory rooftops, C&I installations, and large-scale solar farms, helping businesses optimize system performance, reduce operational risk, and improve investment returns.
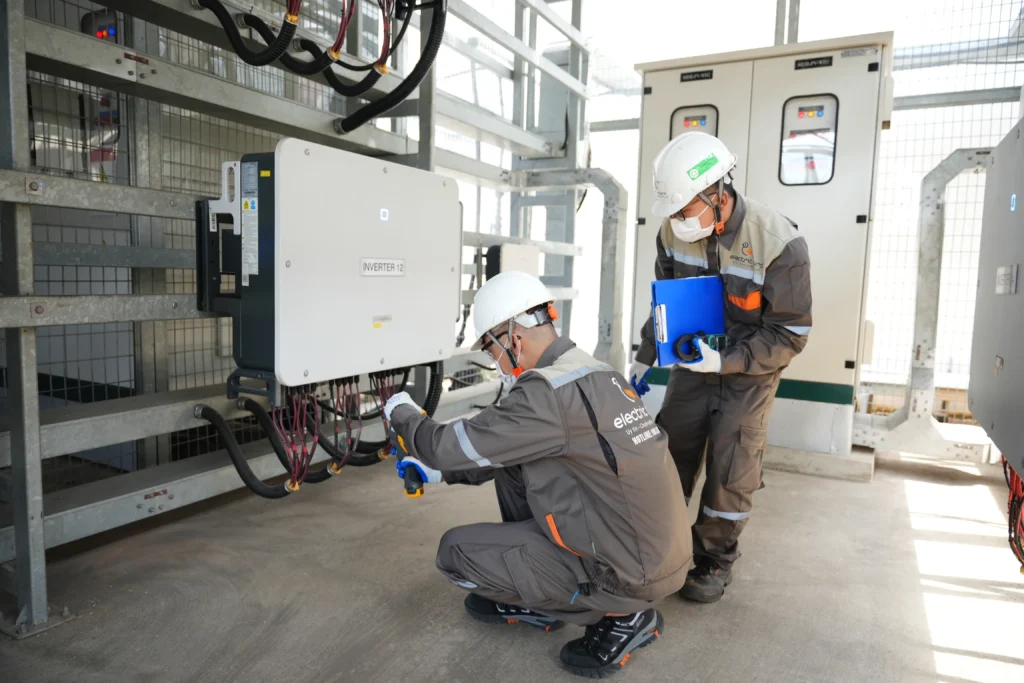
Core capabilities include:
Contact Electric Bird today to receive a comprehensive system health assessment and a tailored O&M package, designed to keep your solar investment performing at its full potential through disciplined SLA and KPI management.
KPIs are technical indicators used to measure the performance, stability, and degradation of a solar system over time. A system is generally considered to be performing well when PR exceeds 80% and System Availability exceeds 98%.
Energy output only reflects the final result. KPIs enable early identification of the root causes behind declining performance, such as soiling accumulation, inverter faults, or unexpected downtime.
A performance ratio solar value between 75% and 85% indicates stable operation. If PR falls below 70%, a full system inspection is necessary to prevent extended generation losses
When Specific Yield drops 5 to 10% below the established baseline for the same system or comparable location, it is a reliable signal that an operational review is warranted.
A well-operated solar plant should achieve System Availability of 98% or above. If availability falls below 95%, a detailed downtime analysis is required to identify and resolve root causes.
Even a 1 to 2% reduction in inverter efficiency translates to the loss of tens of thousands of kWh annually in a large-scale system, directly impacting financial returns and SLA and KPI compliance.


For commercial and industrial projects, rooftop solar power systems are long-lived assets with operational lifespans exceeding 20 years. Without a structured technical governance framework, even a well-installed system can silently underperform, eroding projected cash flows year after year. To address this, Vietnam’s Electricity and Renewable Energy Authority (EREA) under the Ministry of Industry and Trade, […]
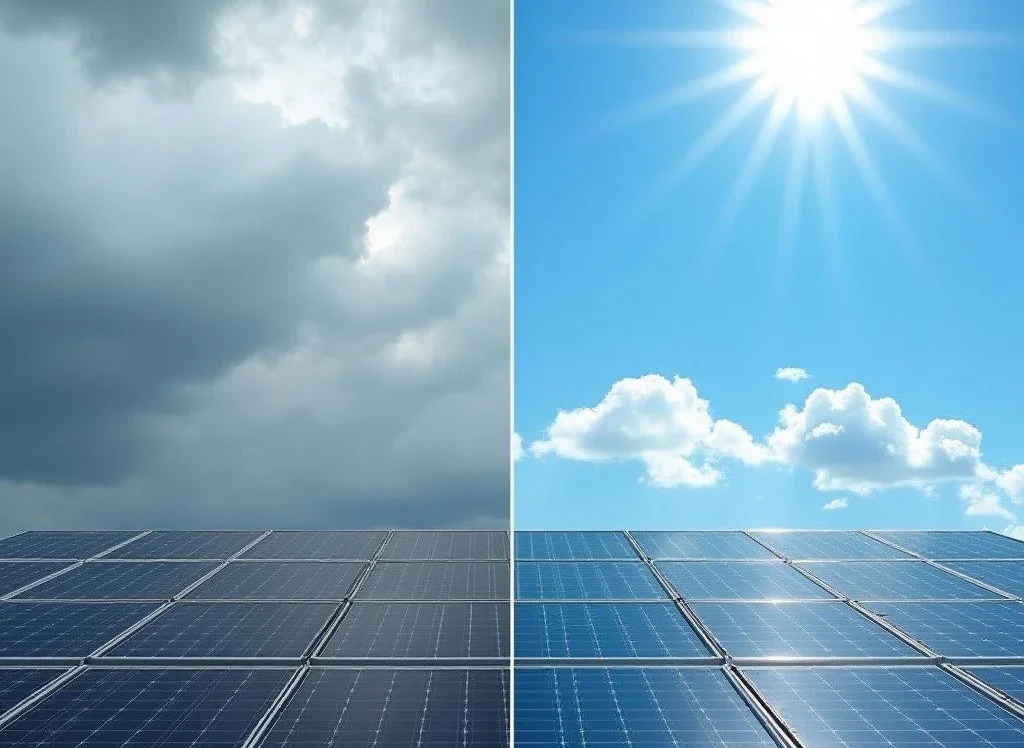
Most underperforming solar power plants share one common trait: they operate reactively. The team responds when something breaks, not before. There is no structured approach to seasonal risk, no trend analysis, and no unified picture of asset health across the year. Vietnam’s climate adds a specific layer of complexity here. The country’s radiation patterns, humidity […]
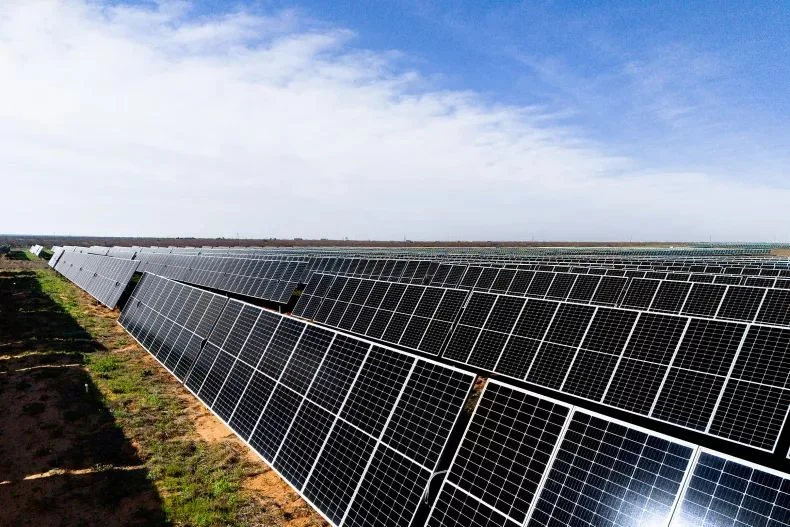
As businesses increasingly focus on the long-term performance of solar energy assets, choosing the right O&M model is no longer an afterthought. It needs to be built into the strategy from the very beginning. Every decision made during the design and installation phase directly influences system efficiency, operational costs, and asset value throughout the entire […]